SENSOR-BASED DISTANCE DETERMINATION FOR CENTERS OF TWO CELLS CHAINED THROUGH A THIRD CELL
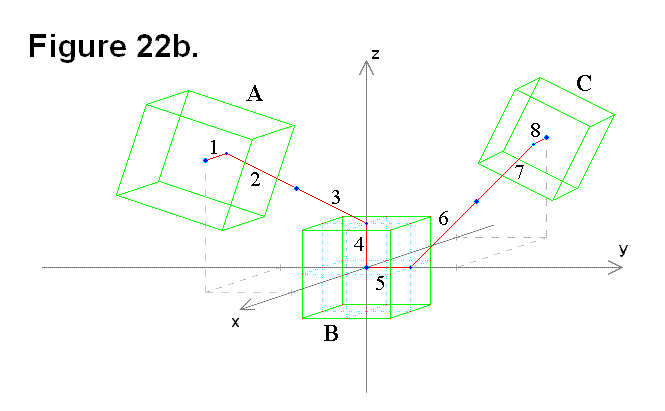
Certain lengths and angles can either be measured with sensors or are known constants that can be used to calculate the distance between the centers of two cells connected to a middle (third) cell such that they are chained in series. In order to determine the distance, each involved module within each cell would have to perform calculations on shared readings from both its own sensors and sensors on the other modules that are involved. In Figures 22a and 22b, 3 cells A, B, and C are drawn as three-dimensional green wire frames to represent the core of the cells (i.e., the cube-shaped region that doesn’t include the telescoping legs and connecting plates). The red numbered lines represent the measureable sections, they are either the distance from the center of the cell cube to the center of the face on the cube surface (all are equal and constant), or the length of the telescoping leg (each one is a variable value). There are two ways that 3 cells can be chained in series. One is shown in Figure 22a, where two cells (A & C) are connected to the middle cell (B) on opposite sides through it along the y-axis. In either case, the numbered red lines are:
- Cell cube center to center of face for cell A connected to 2
- Leg of cell A connected to 1 and 3
- Leg of cell B connected to 4 and 2
- Cell cube center to center of face for cell B connected to 3 and 5
- Cell cube center to center of face for cell B connected to 4 and 6
- Leg of cell B connected to 5 and 7
- Leg of cell C connected to 6 and 8
- Cell cube center to center of face for cell C connected to 7
The lengths of the “cell cube center to center of face” sections are all equal to each other in length L (i.e., L1 = L4 = L5 = L8 = L). For simplicity, all angle values written in formulas in this articleare limited to a single-cycle range of angle (0 ≤ angle < 2π).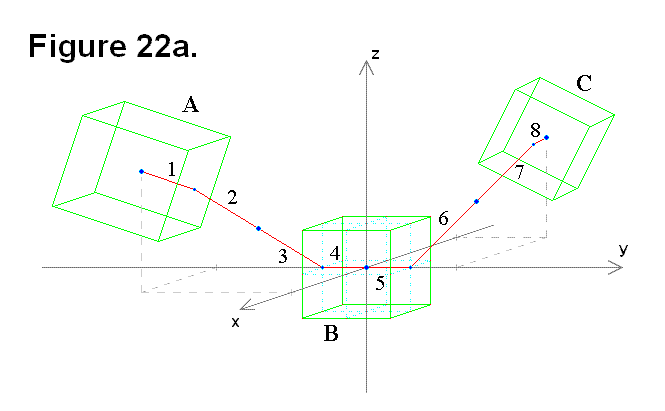 The other is shown in Figure 22b, where two cells (A & C) are connected to the middle cell (B) on adjacent sides through it along the positive y-axis, positive z-axis, and the x-y-z axes origin (where the 3 axes intersect).
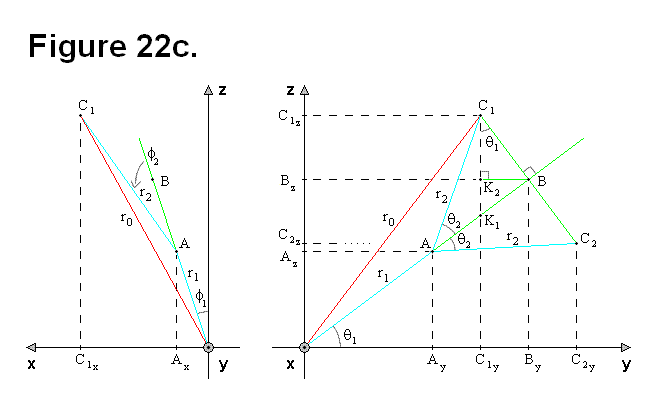
In Figure 22c, the focus is on only some of the red lines, sections 1, 2, and 3 (or alternatively, sections 6, 7, and 8), in Figures 22a and 22b. Vector r1 (line segment OA) corresponds to sections 2 and 3 in Figures 22a and 22b, and vector r2 (line segment AC) corresponds to section 1 in Figures 22a and 22b. Points C1 and C2 are actually two possible graphical representations of a single point C, which is the center of the cell cube. The actual sensors are the universal joint horizontal and vertical angles, the connecting plate rotation angle, and the telescoping leg length. Readings from these sensors can be used as input values in conversion formulas as part of the process to perform the distance calculations. Since θ corresponds to the pivot angle of the leg, and the leg pivots on the face of the cell cube, it is never going to be more than a magnitude of 90° (i.e., 0 ≤ |θ| ≤ π/2).
The following equations written in terms of r are 3-dimensional vector and magnitude formulas:
| |
(Formula #1) |
| |
(Formula #2) |
Although r1 = L, r1 will remain in the equations for clarity. From Figure 22c, the following equations can be derived:
| |
(Equation # 1) |
| |
(Equation # 2) |
| |
(Equation # 3) |
| |
(Equation # 4) |
| |
(Equation # 5) |
If 1 = 0 and 2 = 0, the following equations can be derived and used.
| |
(Equation # 6) |
| |
(Equation # 7) |
| |
(Equation # 8) |
| |
(Equation # 9) |
| |
(Equation # 10) |
The following two equations are independent of any angle value 2.
| |
(Equation # 11) |
| |
(Equation # 12) |
The length of r0 can be calculated without θ1, using only r1, r2, and θ2, but ry and rz cannot.
| |
(Equation # 13) |
The following two equations apply only to point C1, not C2.
| |
(Equation # 14) |
| |
(Equation # 15) |
To make it easier to analyze the diagram in Figure 22c, some of the sections are redrawn in Figure 22d (Cartesian diagram on left side). The separate red-green-blue triangle in Figure 22d on the right side is a diagram of vector OB perpendicular to the plane of the diagram for arbitrary values of 2. 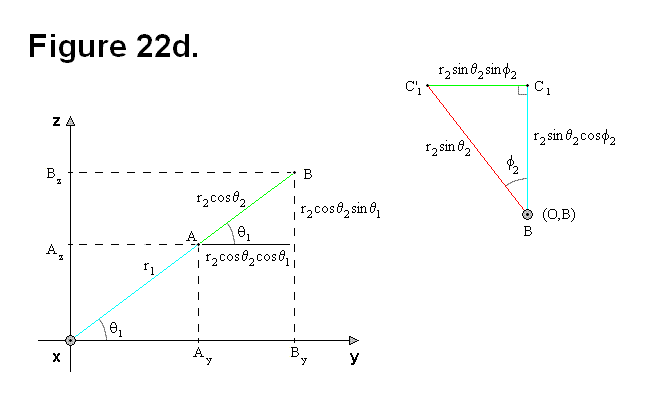
From Figure 22d, the following equations, which are independent of 2, can be derived:
| |
(Equation # 16) |
If 1 = 0, the following equation can be derived.
| |
(Equation # 17) |
For any angle value 2, in the y-z plane:
| |
(Equation # 18) |
| |
(Equation # 19) |
| |
(Equation # 20) |
In red-blue-green triangle figure:
| |
(Equation # 21) |
| |
(Equation # 22) |
For 1 = 0 and arbitrary values of 2:
| |
(Equation # 23) |
To generalize, the ρ-variables in the following equations are fixed to the formulas.
| |
(Equation # 24) |
| |
(Equation # 25) |
| |
(Equation # 26) |
For any value of 1, Figure 20e shows the necessary components for continuing the geometric analysis to derive the necessary formulas. The Cartesian diagrams with the green wire frames are based on Figure 22c for representing arbitrary values of 1 and 2. The blue triangle involves lengths ρz and ρx, and introduces angle β to cover the situation of 1 = 0 and arbitrary values of 2. For 1 = 0, angle β is basically a function of 2 to allow for calculating α as a function of angles 1 and β; all that is necessary is to add the two angles.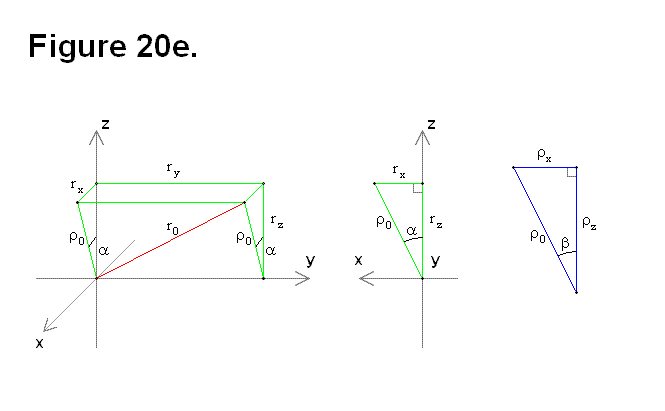 Based on Figure 22e, the following equations can be derived:
| |
(Equation # 27) |
| (Equation # 28) | |
| |
(Equation # 29) |
| |
(Equation # 30) |
| |
(Equation # 31) |
| |
(Equation # 32) |
| |
(Equation # 33) |
Now from the previous equations, the following formulas can be derived:
| |
(Equation # 34) |
| |
(Equation # 35) |
| |
(Equation # 36) |
| |
(Equation # 37) |
To calculate the distance d from the origin O to the center of cell A (shown in Figure 22a), all that is necessary is to include section 4 in the equations:
| |
(Equation # 38) |
| |
(Equation # 39) |
| |
(Equation # 40) |
The previous three equations are re-written to include both sections 1-4 and 5-8 in Figure 22a. The next three are for sections 1-4:
| |
(Equation # 41) |
| |
(Equation # 42) |
| |
(Equation # 43) |
The next three equations are for sections 5-8:
| |
(Equation # 44) |
| |
(Equation # 45) |
| |
(Equation # 46) |
The following equations result from adding the last six equations together, to get the formulas for the distance D from the center of cell A to the center of cell C in Figure 22a:
| |
(Equation # 47) |
| |
(Equation # 48) |
| |
(Equation # 49) |
The following three equations represent sections 5-8 in Figure 22b:
| |
(Equation # 50) |
| |
(Equation # 51) |
| |
(Equation # 52) |
